April 22, 2014

My First PBL Unit - Day 4!

Here are the previous posts if you've missed them:
Day 1
Day 2
Day 3

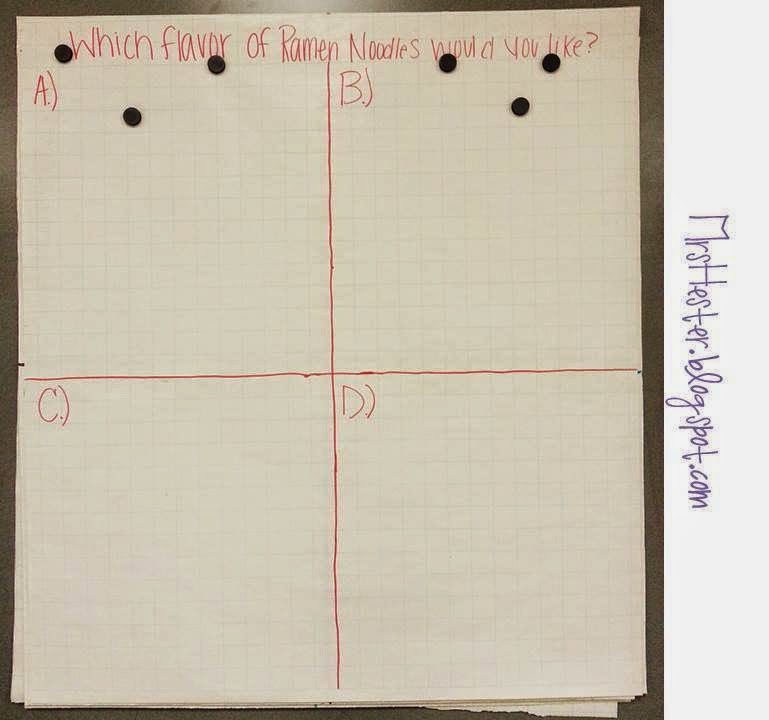
We ended the previous class by recorded our large set of data into our notebooks. We began this class by finding the percentages of each response for every person surveyed this far, our class and our large group. I have students the following information to help them format their page and guide their calculations.

I told them to add together every number in the highlighted boxes and put their total where I have red type. Then I told them to use their own data in every place that was caps and italicized. It worked pretty well actually. Only minimal chaos for a few minutes as students were confused :)

We wrote down the bottom sentence "we will use an online spinner to simulate a random sampling of our data" and then discussed that actually meant. I told students that I wanted to pretend that I had all 187 people surveyed gathered together in the gym at the same time and I wanted to randomly pole 5/10/30/etc. of them at a time. They grasped this concept and we talked about sample size for a bit. I

I asked the question "is it possible for all 5 people that I randomly select to choose a?" They all agreed yes, that's possible. I then asked "is it more or less likely that all people choose a if I randomly select 20 people?" Everyone agreed that was less likely to happen, although still possible. This lead us down a discussion path about larger sample size = more accurate information.

After I felt like students had a grasp of what that last sentence meant, and why we were going to simulate random samples, we used the spinner feature on Math Is Fun, found here. I chose this spinner because it was very user friendly and allowed my students to easily manipulate the section percentages. I demonstrated on the projector how to change the percentages to match those that each group just calculated.


Once each group set the percentages and clicked "update," we were ready to simulate!


I showed how you can set the number of spins, simulating how many people we were choosing at a time. The bar graph under the spinner records the results. I also stressed the importance of hitting the reset button between each random sampling, otherwise the graph would just continue counting and we wouldn't have accurate results. One person in each group usually took it upon themselves to make sure reset was pushed each time. You would hear "RESET!" from across the room at random times. It was pretty funny!!

We recorded our simulation results on page 125 in our notebooks. I showed this to help with formatting.


We didn't have time to start our scatter plots yet, but groups did set up their large grid paper in preparation for graphing. Here's one so you can get the idea.


We'll start creating our scatter plots using simulation data next class!! My students are taking their MAP Test and then going on job shadowing before I see them again for math content. :( It will be about a week before we get back to this project.

So... now that I'm really into my first PBL unit, do you have any advise or pointers? Any things you would have done differently than me? I am completely open to suggestions!

UPDATE: Day 5&6 are here!

My First PBL Unit - Day 3!

Here are Day 1 and Day 2 if you missed them.

Both of those days were full block classes, meaning we had 80 minutes. Day 3 was a "fast Friday" schedule so I only saw them for 40ish minutes. 

When students brought back their survey results, they tallied up each answer choice and then put that data in our shared class spreadsheet. Here is an example from one class.
I projected the spreadsheet so all students could record their important information.

We recorded data on page 124. I showed this... as a reference.

We talked about if our class data was a good representation of the larger group, and how we could then project for an even larger sample size, like our town or state.

This took most the class period. Students used the last 10-15 minutes to brainstorm how they wanted to present their final projects. I think a couple groups are going to make a commercial!! I'm excited to see them!

UPDATE: Day 4 is here!

My First PBL Unit - Day 2!

Here's DAY 1 of the unit if you missed that post.

On Day 2 students arrived in class and finalized their questions in their teams. We completed page 122 in our notebooks about the project. Here is the slide I put on the board to help direct students.


Once each group finalized their wording and choices, they emailed me their questions. I quickly compiled all the questions into one document and made sure formatting was cohesive. I printed each student one copy of the survey to use. We talked about how we needed a lot of data but didn't want to ask a lot of people. We decided that each student would ask all of the survey questions to 10 individuals, making sure they hadn't already been asked the questions from another classmate. When we come back to class next time and compile our data, every team will have 200-250 pieces of data! Perfect.

We also briefly discussed biased data and how we need to make sure to collect random samples. We also need to ask our questions without swaying the participant's vote.

We then set up page 123 to survey our class. Like so...


Each class of students decided that just asking the questions wouldn't get us a good survey - people would be influenced and pressured to vote a certain way. Guess that high-tech way each and every class period decided to use to be anonymous in our surveying? The good 'ole Heads Up, Seven Up approach! Heads down on the desk, eyes closed. The surveying group read their question and answer choices and then recorded the votes. It worked quite well!! HA! I'm just glad they recognized bias and came up with a solution to prevent it! After the class surveys, each group used their data to predict for a larger sample size. I didn't direct the students about how to predict, so groups used different methods (find percent and multiply, set up proportions, use some logic). Worked for me! They all did something mathematically relevant so I am happy.

Since our next step was to survey people outside our class, we went ahead and created a foldable to cover some vocabulary. I have used this foldable for two years now, with a couple tweaks, and really love it. The idea is originally from Sarah at Everybody is a Genius, found here.


Next class, we will compile our data and begin to do some mathematical analysis!

UPDATE: Day 3 is here.

April 14, 2014

My First PBL Unit - Using Data in 8th Grade Math

Well, I'm embarking on a new journey. Read my first thoughts about PBL here.

I'm using the What Will They Think outline from the Buck Institute published at PBLU. While I'm tweaking a few things, the main project description is here if you want it.

DAY 1: The intro

I created a glog to organize all the pertinent information students might need. I'm using it like a project overview page would be used. It's here if you want to check it out. Here's an image if you don't want to click around.

First we watched the Coca-Cola video and talked about how companies do research before they launch new products. We also discussed the Taco Bell Doritos tacos and Jelly Belly flavors. I told them that they were going to be researching and launching a new product. We then brainstormed what they would need to know in order to accomplish this. I made a list on the board and then we created our driving question from that list. 3rd Hour came up with: How can we use research and data to find out what products people want?

From there, I put students into groups of 3 and they brainstormed product ideas and possible answer choices. We talked about needing clear and viable answer choices or our data would be unusable. As they finalized their ideas on a piece of blank paper, I gave these guidelines:


After they had their ideas down, they passed their paper one group clockwise. I set a two minute timer and groups critiqued and offered suggestions. I put up these guidelines for that part:


Once all the rotations were complete, we had about 7 minutes left of class. Each team had a different color to write their comments, this helped students clarify if they had questions later and also provided a bit of accountability; here were how the group papers ended up.


I told them to review the comments and suggestions from their classmates and also get ready to finalize next class. I gave these guidelines:


Next class period I foresee us creating our surveys and making some predictions. I'll report back after Wednesday!

UPDATE: Day 2 is here.
UPDATE: Day 3 is here.
UPDATE: Day 4 is here.